2. 6 City Lightning
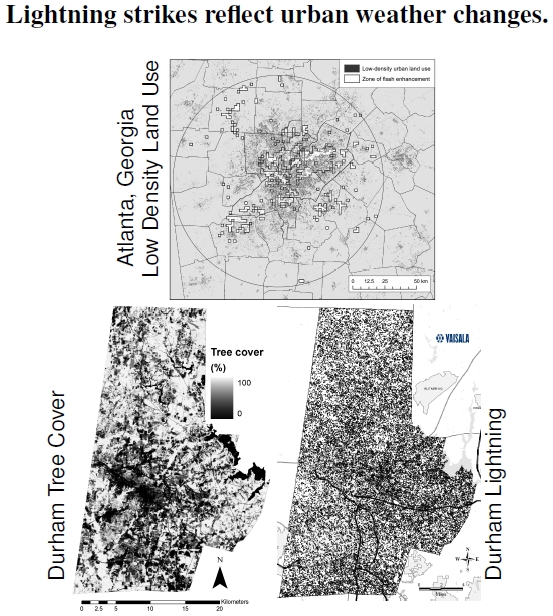
 Figure 2.6: The top map shows urban land use and lightning around Atlanta, Georgia. Dark points indicate low- and high-density land use, while each boxed-in white area shows a region of high lightning strike density, identified using the region’s 8.2 million cloud-to-ground strikes over the years 1992-2003 (courtesy of Tony Stallins; after Stallins and Bentley 2006). The bottom images show, at left, Durham’s 2005 tree cover (courtesy of Joe Sexton) and, at right, locations of the 40,392 lightning strikes observed in Durham County from January 1, 2004, through August 20, 2008 (courtesy of Vaisala, Inc.).
We just examined evidence in Figures 2.4 and 2.5 that urban heat islands spawn thunderstorms that change city weather. Along with thunder, of course, comes lightning, and in another look at how cities affect weather, the top image in Figure 2.6 shows the frequency of lightning strikes in Atlanta over a 12-year time span.[18] During these 12 years, automated equipment measured around 8.2 million cloud-to-ground lightning strikes, with an estimated 50 to 75% more lightning strikes in urban land-use areas![19] This figure plots, along with the strikes, the visual correlation with one measure of urban areas, low-density urban land use.
Mechanistically, urban land use has lots of impervious surfaces that generate urban heat islands that spawn thunderstorms and produce lightning strikes. These strikes occur, therefore, right where people live.
The correlation turns out to be a bit more nuanced than just the existence of impervious surfaces. Much of the housing development in Atlanta has taken place downwind of the major city center that generates the UHI; that situation reinforces the correlation between where people live and increased lightning, but does not really affect the mechanism behind the correlation.
Although there are no statistics, the bottom images show 2005 canopy cover (dark areas mean fewer trees and more urbanization) and the 40,392 lightning strikes in Durham County over a four-and-a-half year period.[20] Do the strikes occur in the urban areas where there’s no canopy? If I squint, I see a downwind correlation, but here’s why science needs statistics: Is there really a correlation, and might something like topography be more important?
Given that urban areas have more lightning, let’s put this it into an economic context. The damage costs associated with lightning strikes in the entire state of Georgia, not just Atlanta, is estimated to be about $18 million per year, according to insurance claims, and around $332 million annually across the entire United States.[21] Though this $332 million is a large number in aggregate, it works out to just over $1 per person in the United States. The Atlanta metropolitan area’s population is around 5 million, covering just under 22,000 km2, meaning Atlanta’s lightning imposes costs around $5 million per year. Lightning strikes might be worthwhile to consider while building cities, though it seems inherently difficult to plan housing developments around their lightning production and attraction characteristics. In the end, if these cost estimates are accurate, the economic burden doesn’t seem inordinate — something like $200 per square kilometer — unless it were my house that was hit by lightning.
————————–
[18]Tony Stallins provided Figure 2.6 showing the frequency of lightning strikes in Atlanta, Georgia. The work is discussed in detail in Stallins (2004), Stallins and Bentley (2006), and Stallins et al. (2006).
[19]The National Lightning Detection Network, a system that measures and locates every lightning strike, is described at thunder.nsstc.nasa.gov.
[20]I obtained the Durham County lightning image, with great appreciation, from Vaisala, Inc., the lightning detection equipment manufacturer and data services provider that owns and operates the U.S. National Lightning Detection Network. I do not have the data itself to test whether or not a correlation exists between lightning strikes and urbanization, but that would be the next step.
[21]Stallins (2004) cites the economic impact of lightning in Georgia and the United States.
During the period of the Stallins and Bentley (2006) study, there were 8.2 million cloud-to-ground lightning strikes across all of Georgia. In the 80km radius area centered on Atlanta there were 939,096 strikes.