2.16 Transpiring Lawns
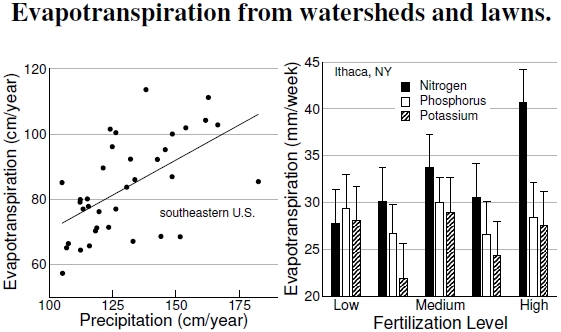
Figure 2.16: The left graph shows that about 60% of the precipitation falling on watersheds in the southeastern United States goes back into the atmosphere through evaporation and transpiration (data from Lu et al. 2003). In essence, these measurements subtract the water flowing out of rivers from the amount falling into those rivers’ watersheds as rain. Vegetation transpired away the difference, in combination with simple evaporation. At right, we see evapotranspiration rates from Kentucky Bluegrass “lawns” fertilized at different levels for different nutrients (after Ebdon et al. 1999). Granted, these lawns in Ithaca, New York, were experimental systems, but they evapotranspired about 30 mm of water per week, or 4 mm per day, much more than the amount needed to cool urban asphalt (see Figure 2.10).
As a broad check on the cooling potential for trees and forests, the left graph in Figure 2.16 arises from measures of the precipitation falling into watersheds and the water flowing out of the streams draining the watersheds. Evapotranspiration makes up the lost water.[49] Durham gets, on average, almost 4 inches of rain each month, or about 1/7 inch (3.2 mm) per day. One-third of this amount equals that needed for cooling hot days (compare the numbers in Figure 2.10), if only this rain were somehow stored in the soil instead of diverted to stormwater systems. Here we see that nearly two-thirds of the rain, twice that needed for cooling, is evapotranspired away naturally.
I admit my bias against lawns, in favor of trees, and the results of the right-hand plot shocked me. Those perfect lawns, doused in fertilizers and pesticides, are the antithesis of ecological messiness. But from the perspective of cooling potential through evapotranspiration, a lawn could far exceed a tree. Here I’m not terribly interested in how evapotranspiration changes with fertilization level, but mainly just the average value compared to trees: For comparison, see Figure 2.14, where we calculated that a tree provides about 1 mm of water per day over it’s spread. This figure shows 30 mm per week for lawns,[50] about 4 mm per day, working out to 4 kg/day over a square meter.[51] That’s much more than the amount needed to cool pavement, and it certainly motivates grassy paving (see Figure 2.18) from a city-cooling perspective.
Realistically, however, environmental features like wind speed obscure these cooling effects, and worse, thermal radiation from buildings can hurt landscape plants. A specific experimental setup in Texas showed that turfgrass evapotranspiration doesn’t reduce the outside wall temperature of nearby buildings.[52] In other words, grass lawns don’t reliably provide the shade of a tall tree next to a building, and that alone can be important regardless of evapotranspiration levels.
Beyond considering a lawn’s cooling benefits, turf perfection comes with a carbon cost from maintenance (Figure 3.10) and water costs for irrigation. For example, water costs outweighed cooling benefits for turfgrass in Tuscon, Arizona, where rocky landscaping with low-water-use shrubs earned the most cost-effective rating.[53] Yet, even while dead, tall grass shades the ground, helping reduce heat island effects by preventing the high thermal mass soil from heating up.
Also remember that trees and grass aren’t always exclusive of one another. Trees handle short-term droughts better by using deeper water sources, and many different types of vegetation can be used to lower temperatures for almost any situation.[54] Even painting walls white can be a good thing, lowering temperatures 2C below air temperature, but so could a wall-climbing, wall-destroying ivy.
————————
[49]The fit for the evapotranspiration versus rainfall graph in Figure 2.14 has an R2=0.32 with the fit y = 27.3 + 0.431x.
[50]Ebdon et al. (1999) performed a study of evapotranspiration in lawns.
[51]Transpiration of 1 kg/day/m2 equals 1 mm/day, so 4 kg/day equals 4 mm/day. This equivalence is best understood by noting that one liter of water (10 cm)3 has a mass of 1 kg. Imagine a square box 10 cm on a side, cut it into 100 slices, each 1 mm thick (10 cm = 100 mm). Those 100 slices cover one square meter. The evapotranspiration value quoted here agrees well with the averages reported by Carrow (1995), pointed out by an anonymous reviewer, for several grass species in the southeastern United States, 3.03–3.80 mm/day, with some experiments exceeding 6 mm/day.
[52]Heilman and Gesch (1991) examined the temperature reduction turfgrass provides to nearby buildings.
[53]McPherson et al. (1989) demonstrated that rocky landscaping was the most cost-effective option in Tuscon, Arizona.
[54]Givoni (1991) reviewed many studies that use vegetation to provide cooling benefits.
