2. 5 City Rainfall
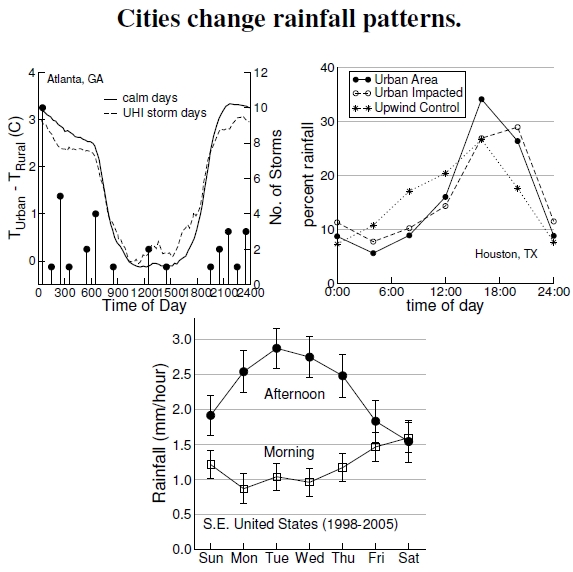
 Figure 2.5: At top left, the solid line shows the average UHI over all calm days in Atlanta, and the dashed line isolates days with UHI-induced thunderstorms. Dots indicate thunderstorm frequencies (after Dixon and Mote 2003). UHIs on storm days show rather unremarkable temperature differences. The top right plot shows summer rainfall patterns in and around Houston, Texas, over a 15-year period, comparing an upwind control area (stars and dotted line), the urban center (filled circle and solid line), and a downwind impacted area (open circles and dashed line). Houston has relatively fewer morning showers and more afternoon rains (after Burian and Shepherd 2005). At bottom, overall rainfall patterns from 1998 to 2005 across the southeastern United states show patterns on a weekly and daily scale (after Bell et al. 2008).
The three plots shown in Figure 2.5 provide an overview of fascinating weather changes at local, regional, and continental spatial scales. At top left, the lines compare UHI intensities for calm days and the 24 hours prior to UHI-induced thunderstorm days in Atlanta, Georgia. Sixteen one-hour periods have significantly different temperatures from the nonstorm control days, meaning that not only do UHI storm day profiles differ vertically (see Figure 2.4), but their daily profiles also differ. The urban heat island mostly occurs in the evening, night, and early morning. Urban temperatures intensify in late afternoon, staying high through the early part of the night, with early morning temperatures declining because of radiative heat loss. Furthermore, rural areas cool down rather quickly at night while urban areas retain heat longer.[13]
More evidence for altered weather comes from a study of 15 years’ worth of thunderstorms, at top right, around Houston, Texas.[14] Compared with an upwind control region, the urban area and downwind urban impacted region have more afternoon rains, 59% and 30%, respectively, along with 80% more storms between noon and midnight in the warm season. I don’t show it here, but comparing these “post-urban” (1984–1999) rainfall patterns with a “pre-urban” period, 1940–1958 also demonstrated that annual precipation decreased by about 10% from 8 PM to 8 AM, and increased by about 14% from noon to 8 PM, a shift most likely attributable to urban heating. Furthermore, between the pre-urban and post-urban periods, summer rainfall amounts decreased by 8% in the upwind control area, but increased by 25% in the urban area. In effect, cities shift around rural rains.
Yet another study, shown at bottom, covered the southern half of the United States, including the Atlantic Ocean and the Gulf of Mexico, using data acquired from the Tropical Rainfall Measuring Mission (TRMM) satellite.[15] Averaging data from 1998 to 2005 demonstrated a strong weekly rainfall pattern in the southeastern United States, along with greatly different morning and afternoon rainfall intensities.[16] In contrast, the southwestern United States displayed no such patterns. It’s thought that these cycles arise due to increased air pollution that decreases the rain droplet size by providing many more condensation particles, increasing the length of time a storm develops, and, in the end, increasing the total rainfall. The midweek rainfall reduction, well before the end of the polluting workweek, poses a mysterious question: Complicated land–ocean interactions seem, at present, the best foundation of an hypothesis.[17]
Thus, heat, humidity, and pollution from cities all play a role in changing urban weather.
————————-
[13]Oke (1982) describes the time course of the urban heat island. Urban areas experience lower radiative heat loss in the early afternoon, but higher losses in the evening and overnight as impervious surfaces slowly release heat. This process also describes how the typical thermal mass behaves in passive solar homes.
[14]Burian and Shepherd (2005) studied rainfall changes between “pre-urban” and ‘post-urban” years in Houston, Texas. The data shown here covered June, July, and August, over the time span 1984–1999.
[15]Information on the rainfall-measuring satellite can be found at trmm.gsfc.nasa.gov.
[16]One of the earliest mentions of weekly patterned rainfalls comes from Ashworth (1929, 1944) involving measurements from London between 1898 and 1943. In that situation, coal-burning factories shut down on Sundays, the day with the lowest precipitation level over the measured period.
[17]Bell et al. (2008) present the weekly morning–afternoon rainfall pattern across the southeastern United States.