Processing data
Many ML algorithms need data that is numeric, complete (no missing) and standardized. Ensembles of trees are the most accommodating and require the least data processing.
[1]:
url = (
    'http://biostat.mc.vanderbilt.edu/'
    'wiki/pub/Main/DataSets/titanic3.xls'
)
[2]:
import pandas as pd
[3]:
df = pd.read_excel(url)
df_orig = df.copy()
Basic inspection
[4]:
df.sample(5)
[4]:
| pclass | survived | name | sex | age | sibsp | parch | ticket | fare | cabin | embarked | boat | body | home.dest | |
|---|---|---|---|---|---|---|---|---|---|---|---|---|---|---|
| 1117 | 3 | 0 | Pekoniemi, Mr. Edvard | male | 21.0 | 0 | 0 | STON/O 2. 3101294 | 7.9250 | NaN | S | NaN | NaN | NaN |
| 412 | 2 | 0 | Fynney, Mr. Joseph J | male | 35.0 | 0 | 0 | 239865 | 26.0000 | NaN | S | NaN | 322.0 | Liverpool / Montreal, PQ |
| 64 | 1 | 1 | Chambers, Mr. Norman Campbell | male | 27.0 | 1 | 0 | 113806 | 53.1000 | E8 | S | 5 | NaN | New York, NY / Ithaca, NY |
| 650 | 3 | 0 | Attalah, Miss. Malake | female | 17.0 | 0 | 0 | 2627 | 14.4583 | NaN | C | NaN | NaN | NaN |
| 912 | 3 | 0 | Karaic, Mr. Milan | male | 30.0 | 0 | 0 | 349246 | 7.8958 | NaN | S | NaN | NaN | NaN |
[5]:
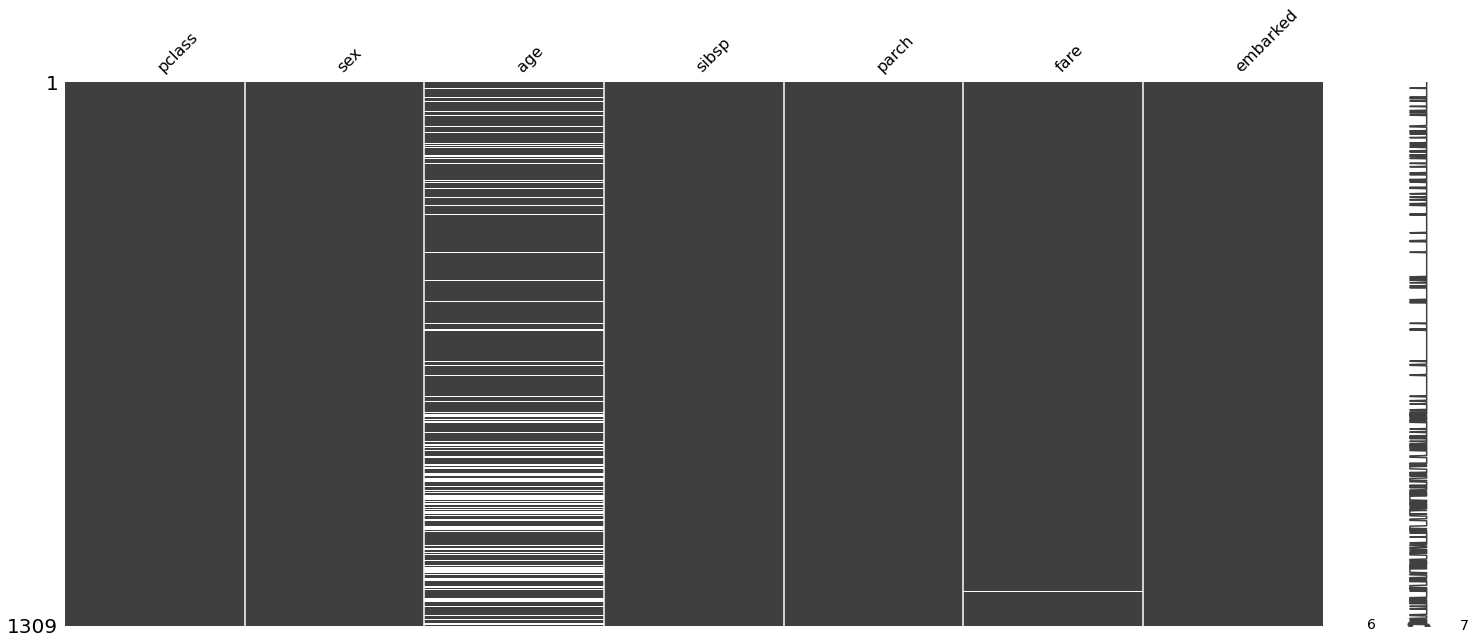
df.info()
<class 'pandas.core.frame.DataFrame'>
RangeIndex: 1309 entries, 0 to 1308
Data columns (total 14 columns):
 #   Column     Non-Null Count  Dtype
---  ------     --------------  -----
 0   pclass     1309 non-null   int64
 1   survived   1309 non-null   int64
 2   name       1309 non-null   object
 3   sex        1309 non-null   object
 4   age        1046 non-null   float64
 5   sibsp      1309 non-null   int64
 6   parch      1309 non-null   int64
 7   ticket     1309 non-null   object
 8   fare       1308 non-null   float64
 9   cabin      295 non-null    object
 10  embarked   1307 non-null   object
 11  boat       486 non-null    object
 12  body       121 non-null    float64
 13  home.dest  745 non-null    object
dtypes: float64(3), int64(4), object(7)
memory usage: 143.3+ KB
Create new features
Sometimes we want to create new features from existing columns. For example, the names column can be mined to extract titles. We illustrate how to do this, but will not use this here.
[8]:
df['title'] = df.name.str.extract('.*([A-Z][a-z]+)\..*')
df.title.value_counts()
[8]:
Mr          757
Miss        260
Mrs         197
Master       61
Dr            8
Rev           8
Col           4
Major         2
Mlle          2
Ms            2
Don           1
Lady          1
Mme           1
Jonkheer      1
Sir           1
Capt          1
Dona          1
Countess      1
Name: title, dtype: int64
Drop features
These features are either uninformative or leak information about the outcome.
[9]:
target = df.survived
df = df.drop(columns = [
    'survived', 'name', 'ticket', 'cabin'
    ,'boat', 'body', 'home.dest', 'title'])
Fill in missing values for categorical values
[12]:
df.select_dtypes('object').isnull().sum()
[12]:
sex         0
embarked    2
dtype: int64
[13]:
df['embarked'] = df['embarked'].fillna('')
Tangent: catboost is nice
Minimal processing or tuning is required to use catboost, making it a nice “default” algorithm.
[14]:
! python3 -m pip install --quiet catboost
[15]:
import catboost
[16]:
from sklearn.model_selection import train_test_split
[17]:
X_train, X_test, y_train, y_test =train_test_split(df, target, random_state=0)
[18]:
cb = catboost.CatBoostClassifier()
[19]:
cb.fit(X_train, y_train,
       cat_features=['sex', 'embarked'],
       verbose=0);
[20]:
cb.score(X_test, y_test)
[20]:
0.8170731707317073
Category encoding
Vanilla encoding
For variables with only a few distinct values, one hot encoding (or dummy variables) is often used. For more values, we can use hash encoding, which is basically the same idea but bins values using a hash function.
We may choose to drop one of the created columns to avoid multicollinearity.
[21]:
pd.get_dummies(df, drop_first=True).head()
[21]:
| pclass | age | sibsp | parch | fare | sex_male | embarked_C | embarked_Q | embarked_S | |
|---|---|---|---|---|---|---|---|---|---|
| 0 | 1 | 29.0000 | 0 | 0 | 211.3375 | 0 | 0 | 0 | 1 |
| 1 | 1 | 0.9167 | 1 | 2 | 151.5500 | 1 | 0 | 0 | 1 |
| 2 | 1 | 2.0000 | 1 | 2 | 151.5500 | 0 | 0 | 0 | 1 |
| 3 | 1 | 30.0000 | 1 | 2 | 151.5500 | 1 | 0 | 0 | 1 |
| 4 | 1 | 25.0000 | 1 | 2 | 151.5500 | 0 | 0 | 0 | 1 |
Target encoding
We can use the target to find a more informative encoding. Note that these methods leak information and are prone to over-fitting.
[22]:
import warnings
warnings.simplefilter('ignore', FutureWarning)
[23]:
import category_encoders as ce
[24]:
te = ce.TargetEncoder()
[25]:
te.fit_transform(df.select_dtypes('number'), target).head()
[25]:
| pclass | age | sibsp | parch | fare | |
|---|---|---|---|---|---|
| 0 | 1 | 29.0000 | 0 | 0 | 211.3375 |
| 1 | 1 | 0.9167 | 1 | 2 | 151.5500 |
| 2 | 1 | 2.0000 | 1 | 2 | 151.5500 |
| 3 | 1 | 30.0000 | 1 | 2 | 151.5500 |
| 4 | 1 | 25.0000 | 1 | 2 | 151.5500 |
Split data into train and test data sets
Before we go further, we split into test and train data sets to avoid data leakage.
[26]:
X_train, X_test, y_train, y_test = train_test_split(df, target)
Category encoding
We will be conservative and avoid risk of leakage
Note we don’t bother to drop columns - multicollinearity is only a problem when fitting linear models without regularization - this is rarely done in ML (c.f. statistics).
[27]:
ohe= ce.OneHotEncoder(cols=['sex','embarked'], use_cat_names=True)
[28]:
X_train = ohe.fit_transform(X_train)
X_test = ohe.transform(X_test)
[29]:
X_train.head()
[29]:
| pclass | sex_male | sex_female | age | sibsp | parch | fare | embarked_S | embarked_C | embarked_Q | embarked_ | |
|---|---|---|---|---|---|---|---|---|---|---|---|
| 414 | 2 | 1 | 0 | 34.0 | 1 | 0 | 21.0000 | 1 | 0 | 0 | 0 |
| 287 | 1 | 1 | 0 | 61.0 | 0 | 0 | 32.3208 | 1 | 0 | 0 | 0 |
| 1279 | 3 | 0 | 1 | 14.0 | 0 | 0 | 7.8542 | 1 | 0 | 0 | 0 |
| 711 | 3 | 1 | 0 | 28.0 | 0 | 0 | 7.2500 | 1 | 0 | 0 | 0 |
| 358 | 2 | 0 | 1 | 42.0 | 0 | 0 | 13.0000 | 1 | 0 | 0 | 0 |
Impute missing numeric values
Vanilla imputation
A simple imputation is to fill with mean or median.
[30]:
from sklearn.impute import SimpleImputer
[31]:
si = SimpleImputer(strategy='mean')
[32]:
X_train.select_dtypes('number').head(3)
[32]:
| pclass | sex_male | sex_female | age | sibsp | parch | fare | embarked_S | embarked_C | embarked_Q | embarked_ | |
|---|---|---|---|---|---|---|---|---|---|---|---|
| 414 | 2 | 1 | 0 | 34.0 | 1 | 0 | 21.0000 | 1 | 0 | 0 | 0 |
| 287 | 1 | 1 | 0 | 61.0 | 0 | 0 | 32.3208 | 1 | 0 | 0 | 0 |
| 1279 | 3 | 0 | 1 | 14.0 | 0 | 0 | 7.8542 | 1 | 0 | 0 | 0 |
We illustrate the code but will try more fancy imputation instead.
X_train[X_train.select_dtypes('number').columns] = \
si.fit_transform(X_train.select_dtypes('number'))
X_test[X_test.select_dtypes('number').columns] = \
si.transform(X_test.select_dtypes('number'))
Fancy imputation
This basically does the same thing as mice in R.
[33]:
from sklearn.experimental import enable_iterative_imputer
from sklearn.impute import IterativeImputer
[34]:
ii = IterativeImputer(random_state=0)
[35]:
X_train[X_train.select_dtypes('number').columns] = \
ii.fit_transform(X_train.select_dtypes('number'))
[36]:
X_test[X_test.select_dtypes('number').columns] =  \
ii.transform(X_test.select_dtypes('number'))
[37]:
X_train.isnull().sum().sum(), X_test.isnull().sum().sum()
[37]:
(0, 0)
Simple example to illustrate differences
[38]:
import numpy as np
[39]:
x = np.array([
    [10, 10],
    [1, 1],
    [2,2],
    [10, 10],
    [10, np.nan],
    [np.nan, 10],
    [np.nan, np.nan]
])
[40]:
si.fit_transform(x)
[40]:
array([[10. , 10. ],
       [ 1. ,  1. ],
       [ 2. ,  2. ],
       [10. , 10. ],
       [10. ,  6.6],
       [ 6.6, 10. ],
       [ 6.6,  6.6]])
[41]:
ii.fit_transform(x)
[41]:
array([[10.        , 10.        ],
       [ 1.        ,  1.        ],
       [ 2.        ,  2.        ],
       [10.        , 10.        ],
       [10.        ,  9.99968523],
       [10.00094638, 10.        ],
       [ 7.1668244 ,  7.1666142 ]])
[42]:
X_train.to_csv('data/X_train_unscaled.csv', index=False)
X_test.to_csv('data/X_test_unscaled.csv', index=False)
y_train.to_csv('data/y_train_unscaled.csv', index=False)
y_test.to_csv('data/y_test_unscaled.csv', index=False)
Standardize data
[43]:
from sklearn.preprocessing import StandardScaler
[44]:
scaler = StandardScaler()
[45]:
X_train.iloc[:, :] = scaler.fit_transform(X_train)
X_test.iloc[:, :] = scaler.transform(X_test)
Save processed data for future use
[46]:
X_train.to_csv('data/X_train.csv', index=False)
X_test.to_csv('data/X_test.csv', index=False)
y_train.to_csv('data/y_train.csv', index=False)
y_test.to_csv('data/y_test.csv', index=False)