Graphics and Visualization in Python
Python has a bewildering number of graphics libraries, catering to different needs. If you want a better understanding of the Python visualization landscape, see the following series of blog posts:
However for simple statistical plots, the matplotlib and seaborn libraries suffice most of the time:
As shown below, pandas also has useful plotting functionality.
[1]:
%matplotlib inline
import numpy as np
import numpy.random as rng
import pandas as pd
import scipy.stats as stats
import matplotlib.pyplot as plt
import matplotlib as mpl
import seaborn as sns
[2]:
import warnings
warnings.filterwarnings("ignore")
Pandas
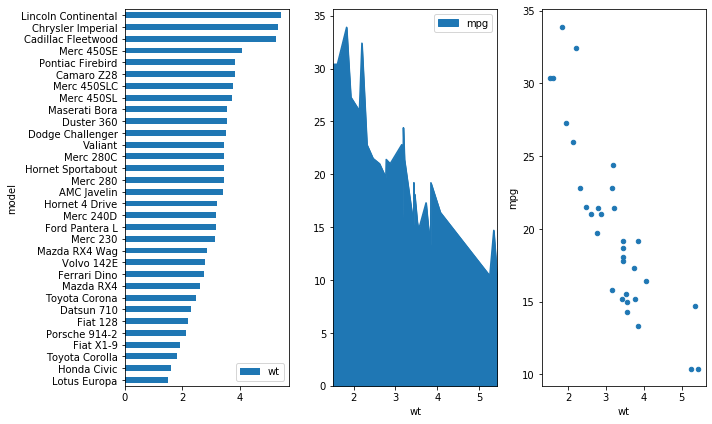
You can do plots directly from a Series or DataFrame. See docs. Some interesting plots available in Pandas are
Scatter matrix plots
Andrews curves
Autocorrelation plots
Bootstrap plots
[3]:
url = 'https://gist.githubusercontent.com/seankross/a412dfbd88b3db70b74b/raw/5f23f993cd87c283ce766e7ac6b329ee7cc2e1d1/mtcars.csv'
df = pd.read_csv(url)
[4]:
df.head()
[4]:
| model | mpg | cyl | disp | hp | drat | wt | qsec | vs | am | gear | carb | |
|---|---|---|---|---|---|---|---|---|---|---|---|---|
| 0 | Mazda RX4 | 21.0 | 6 | 160.0 | 110 | 3.90 | 2.620 | 16.46 | 0 | 1 | 4 | 4 |
| 1 | Mazda RX4 Wag | 21.0 | 6 | 160.0 | 110 | 3.90 | 2.875 | 17.02 | 0 | 1 | 4 | 4 |
| 2 | Datsun 710 | 22.8 | 4 | 108.0 | 93 | 3.85 | 2.320 | 18.61 | 1 | 1 | 4 | 1 |
| 3 | Hornet 4 Drive | 21.4 | 6 | 258.0 | 110 | 3.08 | 3.215 | 19.44 | 1 | 0 | 3 | 1 |
| 4 | Hornet Sportabout | 18.7 | 8 | 360.0 | 175 | 3.15 | 3.440 | 17.02 | 0 | 0 | 3 | 2 |
[5]:
fig, axes = plt.subplots(1,3,figsize=(10, 6))
df.sort_values('wt').plot('model', 'wt', kind='barh', ax=axes[0])
df.sort_values('wt').plot('wt', 'mpg', kind='scatter', ax=axes[2])
df.sort_values('wt').plot('wt', 'mpg', kind='area', ax=axes[1])
plt.tight_layout()
pass
Matplotlib
Matplotlib has a “functional” interface similar to Matlab via the pyplot module for simple interactive use, as well as an object-oriented interface that is useful for more complex graphic creations.
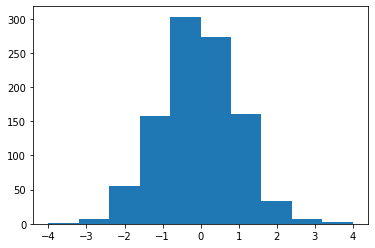
Types of plots
[6]:
plt.hist(np.random.randn(1000), bins=np.linspace(-4,4,11))
pass
[7]:
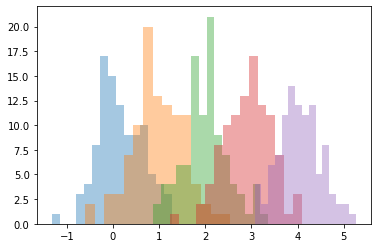
xs = [np.random.normal(mu, 0.5, (100)) for mu in range(5)]
[8]:
for x in xs:
    plt.hist(x, bins=15, alpha=0.4)
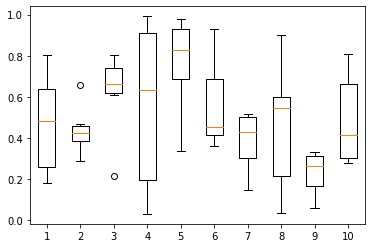
[9]:
plt.boxplot(np.random.random((6,10)))
pass
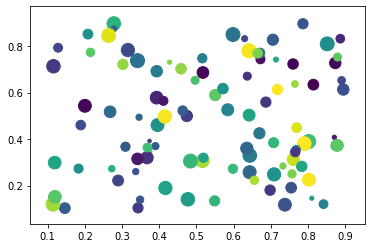
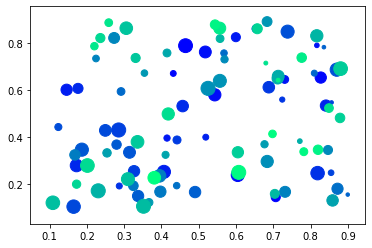
[10]:
plt.scatter(*np.random.uniform(0.1, 0.9, (2,100)),
            s=np.random.randint(10, 200, 100),
            c=np.random.random(100))
pass
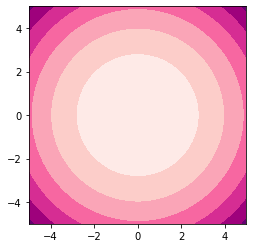
[11]:
x = y = np.linspace(-5, 5, 100)
X, Y = np.meshgrid(x, y)
Z = X**2 + Y**2
plt.contourf(X, Y, Z, cmap=plt.cm.RdPu)
plt.axis('square')
pass
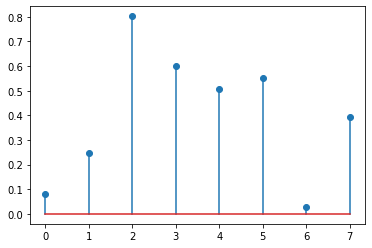
[12]:
plt.stem(np.random.random(8))
plt.margins(0.05)
pass
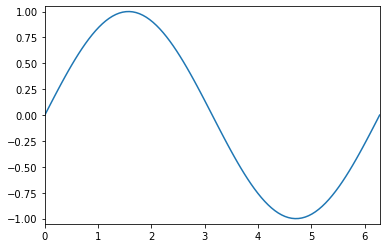
[13]:
x = np.linspace(0, 2*np.pi, 100)
y = np.sin(x)
[14]:
plt.plot(x, y)
plt.axis([0, 2*np.pi, -1.05, 1.05,])
pass
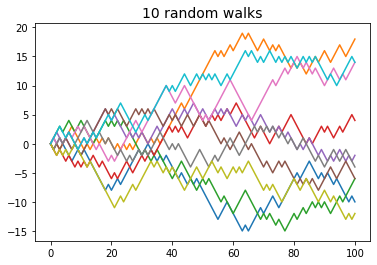
[15]:
xs = np.c_[np.zeros(10), np.random.choice([-1,1], (10, 100)).cumsum(axis=1)]
plt.plot(xs.T)
plt.title('10 random walks', fontsize=14)
pass
Displaying arrays
[16]:
x = np.random.random((80, 80, 3))
[17]:
plt.imshow(x)
pass
[18]:
plt.imshow(x, interpolation='bicubic')
pass
[19]:
plt.imshow(x.mean(axis=-1), cmap='bone')
pass
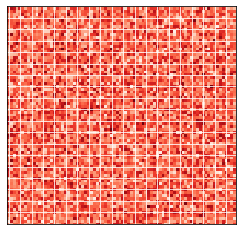
[20]:
plt.imshow(x.mean(axis=-1), cmap='Reds')
plt.xticks(range(0, x.shape[1], 4))
plt.yticks(range(0, x.shape[0], 4))
plt.grid(color='white')
ax = plt.gca()
ax.set_xticklabels([])
ax.set_yticklabels([])
ax.xaxis.set_ticks_position('none')
ax.yaxis.set_ticks_position('none')
pass
Colors
[21]:
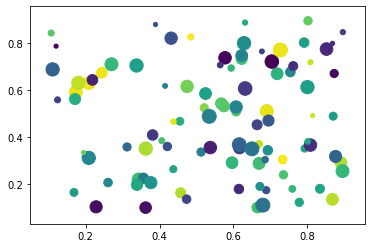
plt.scatter(*np.random.uniform(0.1, 0.9, (2,100)),
            s=np.random.randint(10, 200, 100),
            c=np.random.random(100))
pass
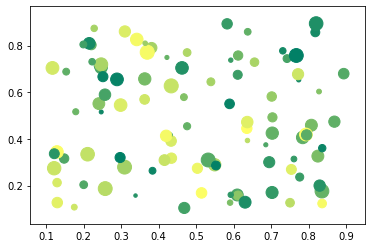
[22]:
plt.scatter(*np.random.uniform(0.1, 0.9, (2,100)),
            s=np.random.randint(10, 200, 100),
            c=np.random.random(100), cmap='summer')
pass
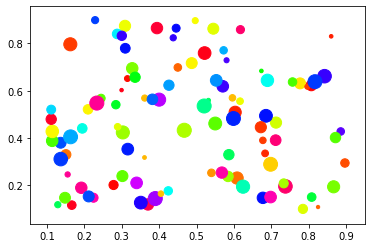
[23]:
plt.scatter(*np.random.uniform(0.1, 0.9, (2,100)),
            s=np.random.randint(10, 200, 100),
            c=np.random.random(100), cmap='hsv')
pass
Getting a list of colors from a colormap
Giving an argument of 0.0 < x < 1.0 to a colormap gives the appropriate interpolated color.
[24]:
# find the bottom, middle and top colors of the winter colormap
colors = plt.cm.winter(np.linspace(0, 1, 100))
colors[:3]
[24]:
array([[0.        , 0.        , 1.        , 1.        ],
       [0.        , 0.00784314, 0.99607843, 1.        ],
       [0.        , 0.01960784, 0.99019608, 1.        ]])
[25]:
plt.scatter(*np.random.uniform(0.1, 0.9, (2,100)),
            s=np.random.randint(10, 200, 100),
            c=colors)
pass
Styles
[26]:
plt.style.available
[26]:
['seaborn-dark',
 'seaborn-darkgrid',
 'seaborn-ticks',
 'fivethirtyeight',
 'seaborn-whitegrid',
 'classic',
 '_classic_test',
 'fast',
 'seaborn-talk',
 'seaborn-dark-palette',
 'seaborn-bright',
 'seaborn-pastel',
 'grayscale',
 'seaborn-notebook',
 'ggplot',
 'seaborn-colorblind',
 'seaborn-muted',
 'seaborn',
 'Solarize_Light2',
 'seaborn-paper',
 'bmh',
 'tableau-colorblind10',
 'seaborn-white',
 'dark_background',
 'seaborn-poster',
 'seaborn-deep']
[27]:
x = np.linspace(0, 2*np.pi, 100)
y = np.sin(x)
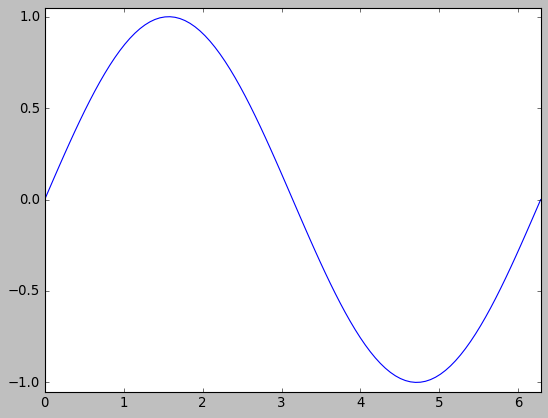
[28]:
with plt.style.context('classic'):
    plt.plot(x, y)
    plt.axis([0, 2*np.pi, -1.05, 1.05,])
[29]:
with plt.style.context('fivethirtyeight'):
    plt.plot(x, y)
    plt.axis([0, 2*np.pi, -1.05, 1.05,])
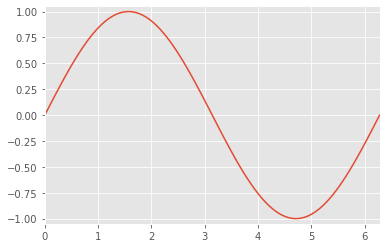
[30]:
with plt.style.context('ggplot'):
    plt.plot(x, y)
    plt.axis([0, 2*np.pi, -1.05, 1.05,])
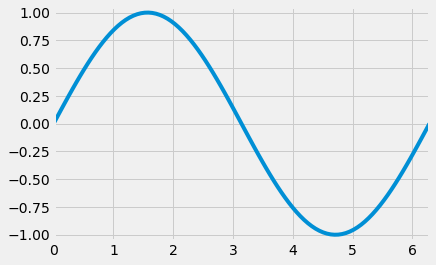
[31]:
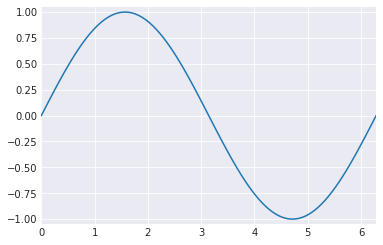
with plt.style.context('seaborn-darkgrid'):
    plt.plot(x, y)
    plt.axis([0, 2*np.pi, -1.05, 1.05,])
[32]:
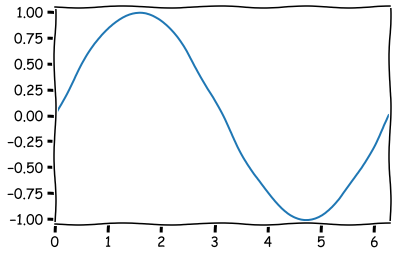
with plt.xkcd():
    plt.plot(x, y)
    plt.axis([0, 2*np.pi, -1.05, 1.05,])
Creating your own style
Many, many options can be configured.
[33]:
plt.rcParams
[33]:
RcParams({'_internal.classic_mode': False,
          'agg.path.chunksize': 0,
          'animation.avconv_args': [],
          'animation.avconv_path': 'avconv',
          'animation.bitrate': -1,
          'animation.codec': 'h264',
          'animation.convert_args': [],
          'animation.convert_path': 'convert',
          'animation.embed_limit': 20.0,
          'animation.ffmpeg_args': [],
          'animation.ffmpeg_path': 'ffmpeg',
          'animation.frame_format': 'png',
          'animation.html': 'none',
          'animation.html_args': [],
          'animation.writer': 'ffmpeg',
          'axes.autolimit_mode': 'data',
          'axes.axisbelow': 'line',
          'axes.edgecolor': 'black',
          'axes.facecolor': 'white',
          'axes.formatter.limits': [-7, 7],
          'axes.formatter.min_exponent': 0,
          'axes.formatter.offset_threshold': 4,
          'axes.formatter.use_locale': False,
          'axes.formatter.use_mathtext': False,
          'axes.formatter.useoffset': True,
          'axes.grid': False,
          'axes.grid.axis': 'both',
          'axes.grid.which': 'major',
          'axes.labelcolor': 'black',
          'axes.labelpad': 4.0,
          'axes.labelsize': 'medium',
          'axes.labelweight': 'normal',
          'axes.linewidth': 0.8,
          'axes.prop_cycle': cycler('color', ['#1f77b4', '#ff7f0e', '#2ca02c', '#d62728', '#9467bd', '#8c564b', '#e377c2', '#7f7f7f', '#bcbd22', '#17becf']),
          'axes.spines.bottom': True,
          'axes.spines.left': True,
          'axes.spines.right': True,
          'axes.spines.top': True,
          'axes.titlepad': 6.0,
          'axes.titlesize': 'large',
          'axes.titleweight': 'normal',
          'axes.unicode_minus': True,
          'axes.xmargin': 0.05,
          'axes.ymargin': 0.05,
          'axes3d.grid': True,
          'backend': 'module://ipykernel.pylab.backend_inline',
          'backend_fallback': True,
          'boxplot.bootstrap': None,
          'boxplot.boxprops.color': 'black',
          'boxplot.boxprops.linestyle': '-',
          'boxplot.boxprops.linewidth': 1.0,
          'boxplot.capprops.color': 'black',
          'boxplot.capprops.linestyle': '-',
          'boxplot.capprops.linewidth': 1.0,
          'boxplot.flierprops.color': 'black',
          'boxplot.flierprops.linestyle': 'none',
          'boxplot.flierprops.linewidth': 1.0,
          'boxplot.flierprops.marker': 'o',
          'boxplot.flierprops.markeredgecolor': 'black',
          'boxplot.flierprops.markeredgewidth': 1.0,
          'boxplot.flierprops.markerfacecolor': 'none',
          'boxplot.flierprops.markersize': 6.0,
          'boxplot.meanline': False,
          'boxplot.meanprops.color': 'C2',
          'boxplot.meanprops.linestyle': '--',
          'boxplot.meanprops.linewidth': 1.0,
          'boxplot.meanprops.marker': '^',
          'boxplot.meanprops.markeredgecolor': 'C2',
          'boxplot.meanprops.markerfacecolor': 'C2',
          'boxplot.meanprops.markersize': 6.0,
          'boxplot.medianprops.color': 'C1',
          'boxplot.medianprops.linestyle': '-',
          'boxplot.medianprops.linewidth': 1.0,
          'boxplot.notch': False,
          'boxplot.patchartist': False,
          'boxplot.showbox': True,
          'boxplot.showcaps': True,
          'boxplot.showfliers': True,
          'boxplot.showmeans': False,
          'boxplot.vertical': True,
          'boxplot.whiskerprops.color': 'black',
          'boxplot.whiskerprops.linestyle': '-',
          'boxplot.whiskerprops.linewidth': 1.0,
          'boxplot.whiskers': 1.5,
          'contour.corner_mask': True,
          'contour.negative_linestyle': 'dashed',
          'datapath': '/Users/cliburn/opt/anaconda3/lib/python3.7/site-packages/matplotlib/mpl-data',
          'date.autoformatter.day': '%Y-%m-%d',
          'date.autoformatter.hour': '%m-%d %H',
          'date.autoformatter.microsecond': '%M:%S.%f',
          'date.autoformatter.minute': '%d %H:%M',
          'date.autoformatter.month': '%Y-%m',
          'date.autoformatter.second': '%H:%M:%S',
          'date.autoformatter.year': '%Y',
          'docstring.hardcopy': False,
          'errorbar.capsize': 0.0,
          'examples.directory': '',
          'figure.autolayout': False,
          'figure.constrained_layout.h_pad': 0.04167,
          'figure.constrained_layout.hspace': 0.02,
          'figure.constrained_layout.use': False,
          'figure.constrained_layout.w_pad': 0.04167,
          'figure.constrained_layout.wspace': 0.02,
          'figure.dpi': 72.0,
          'figure.edgecolor': (1, 1, 1, 0),
          'figure.facecolor': (1, 1, 1, 0),
          'figure.figsize': [6.0, 4.0],
          'figure.frameon': True,
          'figure.max_open_warning': 20,
          'figure.subplot.bottom': 0.125,
          'figure.subplot.hspace': 0.2,
          'figure.subplot.left': 0.125,
          'figure.subplot.right': 0.9,
          'figure.subplot.top': 0.88,
          'figure.subplot.wspace': 0.2,
          'figure.titlesize': 'large',
          'figure.titleweight': 'normal',
          'font.cursive': ['Apple Chancery',
                           'Textile',
                           'Zapf Chancery',
                           'Sand',
                           'Script MT',
                           'Felipa',
                           'cursive'],
          'font.family': ['sans-serif'],
          'font.fantasy': ['Comic Sans MS',
                           'Chicago',
                           'Charcoal',
                           'Impact',
                           'Western',
                           'Humor Sans',
                           'xkcd',
                           'fantasy'],
          'font.monospace': ['DejaVu Sans Mono',
                             'Bitstream Vera Sans Mono',
                             'Computer Modern Typewriter',
                             'Andale Mono',
                             'Nimbus Mono L',
                             'Courier New',
                             'Courier',
                             'Fixed',
                             'Terminal',
                             'monospace'],
          'font.sans-serif': ['DejaVu Sans',
                              'Bitstream Vera Sans',
                              'Computer Modern Sans Serif',
                              'Lucida Grande',
                              'Verdana',
                              'Geneva',
                              'Lucid',
                              'Arial',
                              'Helvetica',
                              'Avant Garde',
                              'sans-serif'],
          'font.serif': ['DejaVu Serif',
                         'Bitstream Vera Serif',
                         'Computer Modern Roman',
                         'New Century Schoolbook',
                         'Century Schoolbook L',
                         'Utopia',
                         'ITC Bookman',
                         'Bookman',
                         'Nimbus Roman No9 L',
                         'Times New Roman',
                         'Times',
                         'Palatino',
                         'Charter',
                         'serif'],
          'font.size': 10.0,
          'font.stretch': 'normal',
          'font.style': 'normal',
          'font.variant': 'normal',
          'font.weight': 'normal',
          'grid.alpha': 1.0,
          'grid.color': '#b0b0b0',
          'grid.linestyle': '-',
          'grid.linewidth': 0.8,
          'hatch.color': 'black',
          'hatch.linewidth': 1.0,
          'hist.bins': 10,
          'image.aspect': 'equal',
          'image.cmap': 'viridis',
          'image.composite_image': True,
          'image.interpolation': 'nearest',
          'image.lut': 256,
          'image.origin': 'upper',
          'image.resample': True,
          'interactive': True,
          'keymap.all_axes': ['a'],
          'keymap.back': ['left', 'c', 'backspace', 'MouseButton.BACK'],
          'keymap.copy': ['ctrl+c', 'cmd+c'],
          'keymap.forward': ['right', 'v', 'MouseButton.FORWARD'],
          'keymap.fullscreen': ['f', 'ctrl+f'],
          'keymap.grid': ['g'],
          'keymap.grid_minor': ['G'],
          'keymap.help': ['f1'],
          'keymap.home': ['h', 'r', 'home'],
          'keymap.pan': ['p'],
          'keymap.quit': ['ctrl+w', 'cmd+w', 'q'],
          'keymap.quit_all': ['W', 'cmd+W', 'Q'],
          'keymap.save': ['s', 'ctrl+s'],
          'keymap.xscale': ['k', 'L'],
          'keymap.yscale': ['l'],
          'keymap.zoom': ['o'],
          'legend.borderaxespad': 0.5,
          'legend.borderpad': 0.4,
          'legend.columnspacing': 2.0,
          'legend.edgecolor': '0.8',
          'legend.facecolor': 'inherit',
          'legend.fancybox': True,
          'legend.fontsize': 'medium',
          'legend.framealpha': 0.8,
          'legend.frameon': True,
          'legend.handleheight': 0.7,
          'legend.handlelength': 2.0,
          'legend.handletextpad': 0.8,
          'legend.labelspacing': 0.5,
          'legend.loc': 'best',
          'legend.markerscale': 1.0,
          'legend.numpoints': 1,
          'legend.scatterpoints': 1,
          'legend.shadow': False,
          'legend.title_fontsize': None,
          'lines.antialiased': True,
          'lines.color': 'C0',
          'lines.dash_capstyle': 'butt',
          'lines.dash_joinstyle': 'round',
          'lines.dashdot_pattern': [6.4, 1.6, 1.0, 1.6],
          'lines.dashed_pattern': [3.7, 1.6],
          'lines.dotted_pattern': [1.0, 1.65],
          'lines.linestyle': '-',
          'lines.linewidth': 1.5,
          'lines.marker': 'None',
          'lines.markeredgecolor': 'auto',
          'lines.markeredgewidth': 1.0,
          'lines.markerfacecolor': 'auto',
          'lines.markersize': 6.0,
          'lines.scale_dashes': True,
          'lines.solid_capstyle': 'projecting',
          'lines.solid_joinstyle': 'round',
          'markers.fillstyle': 'full',
          'mathtext.bf': 'sans:bold',
          'mathtext.cal': 'cursive',
          'mathtext.default': 'it',
          'mathtext.fallback_to_cm': True,
          'mathtext.fontset': 'dejavusans',
          'mathtext.it': 'sans:italic',
          'mathtext.rm': 'sans',
          'mathtext.sf': 'sans',
          'mathtext.tt': 'monospace',
          'patch.antialiased': True,
          'patch.edgecolor': 'black',
          'patch.facecolor': 'C0',
          'patch.force_edgecolor': False,
          'patch.linewidth': 1.0,
          'path.effects': [],
          'path.simplify': True,
          'path.simplify_threshold': 0.1111111111111111,
          'path.sketch': None,
          'path.snap': True,
          'pdf.compression': 6,
          'pdf.fonttype': 3,
          'pdf.inheritcolor': False,
          'pdf.use14corefonts': False,
          'pgf.preamble': '',
          'pgf.rcfonts': True,
          'pgf.texsystem': 'xelatex',
          'polaraxes.grid': True,
          'ps.distiller.res': 6000,
          'ps.fonttype': 3,
          'ps.papersize': 'letter',
          'ps.useafm': False,
          'ps.usedistiller': False,
          'savefig.bbox': None,
          'savefig.directory': '~',
          'savefig.dpi': 'figure',
          'savefig.edgecolor': 'white',
          'savefig.facecolor': 'white',
          'savefig.format': 'png',
          'savefig.frameon': True,
          'savefig.jpeg_quality': 95,
          'savefig.orientation': 'portrait',
          'savefig.pad_inches': 0.1,
          'savefig.transparent': False,
          'scatter.edgecolors': 'face',
          'scatter.marker': 'o',
          'svg.fonttype': 'path',
          'svg.hashsalt': None,
          'svg.image_inline': True,
          'text.antialiased': True,
          'text.color': 'black',
          'text.hinting': 'auto',
          'text.hinting_factor': 8,
          'text.latex.preamble': '',
          'text.latex.preview': False,
          'text.latex.unicode': True,
          'text.usetex': False,
          'timezone': 'UTC',
          'tk.window_focus': False,
          'toolbar': 'toolbar2',
          'verbose.fileo': 'sys.stdout',
          'verbose.level': 'silent',
          'webagg.address': '127.0.0.1',
          'webagg.open_in_browser': True,
          'webagg.port': 8988,
          'webagg.port_retries': 50,
          'xtick.alignment': 'center',
          'xtick.bottom': True,
          'xtick.color': 'black',
          'xtick.direction': 'out',
          'xtick.labelbottom': True,
          'xtick.labelsize': 'medium',
          'xtick.labeltop': False,
          'xtick.major.bottom': True,
          'xtick.major.pad': 3.5,
          'xtick.major.size': 3.5,
          'xtick.major.top': True,
          'xtick.major.width': 0.8,
          'xtick.minor.bottom': True,
          'xtick.minor.pad': 3.4,
          'xtick.minor.size': 2.0,
          'xtick.minor.top': True,
          'xtick.minor.visible': False,
          'xtick.minor.width': 0.6,
          'xtick.top': False,
          'ytick.alignment': 'center_baseline',
          'ytick.color': 'black',
          'ytick.direction': 'out',
          'ytick.labelleft': True,
          'ytick.labelright': False,
          'ytick.labelsize': 'medium',
          'ytick.left': True,
          'ytick.major.left': True,
          'ytick.major.pad': 3.5,
          'ytick.major.right': True,
          'ytick.major.size': 3.5,
          'ytick.major.width': 0.8,
          'ytick.minor.left': True,
          'ytick.minor.pad': 3.4,
          'ytick.minor.right': True,
          'ytick.minor.size': 2.0,
          'ytick.minor.visible': False,
          'ytick.minor.width': 0.6,
          'ytick.right': False})
[34]:
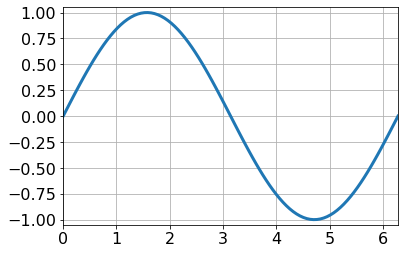
%%file foo.mplstyle
axes.grid: True
axes.titlesize : 24
axes.labelsize : 20
lines.linewidth : 3
lines.markersize : 10
xtick.labelsize : 16
ytick.labelsize : 16
Overwriting foo.mplstyle
[35]:
with plt.style.context('foo.mplstyle'):
    plt.plot(x, y)
    plt.axis([0, 2*np.pi, -1.05, 1.05,])
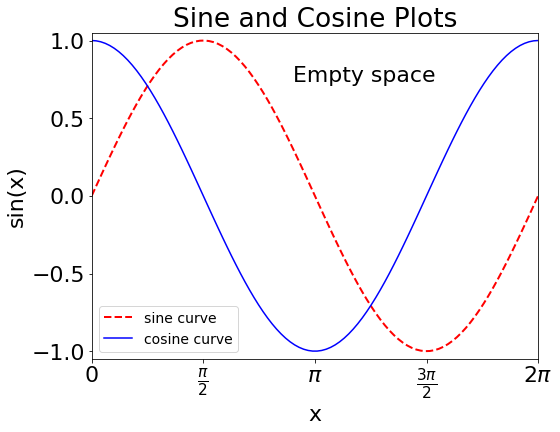
Customizing plots
[36]:
plt.rcParams.update({'font.size': 22})

fig = plt.figure(figsize=(8,6))
ax = plt.subplot(1,1,1)
plt.plot(x, y, color='red', linewidth=2, linestyle='dashed', label='sine curve')
plt.plot(x, np.cos(x), 'b-', label='cosine curve')
plt.legend(loc='best', fontsize=14)
plt.axis([0, 2*np.pi, -1.05, 1.05,])
plt.xlabel('x')
plt.ylabel('sin(x)')
plt.xticks([0,0.5*np.pi,np.pi,1.5*np.pi,2*np.pi],
           [0, r'$\frac{\pi}{2}$', r'$\pi$', r'$\frac{3\pi}{2}$', r'$2\pi$'])
plt.title('Sine and Cosine Plots')
plt.text(0.45, 0.9, 'Empty space', transform=ax.transAxes, ha='left', va='top')
pass
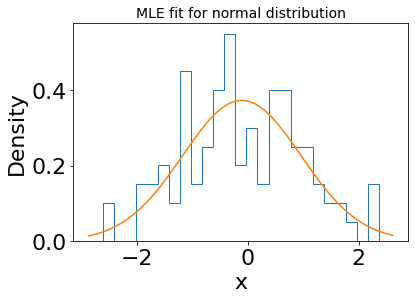
[37]:
x = np.random.randn(100)
plt.hist(x, bins=25, histtype='step', normed=True)
mu, sigma = stats.norm.fit(x)
xp = np.linspace(*plt.xlim(), 100)
plt.plot(xp, stats.norm(mu, sigma).pdf(xp))
plt.xlabel('x')
plt.ylabel('Density')
plt.title('MLE fit for normal distribution', fontsize=14)
pass
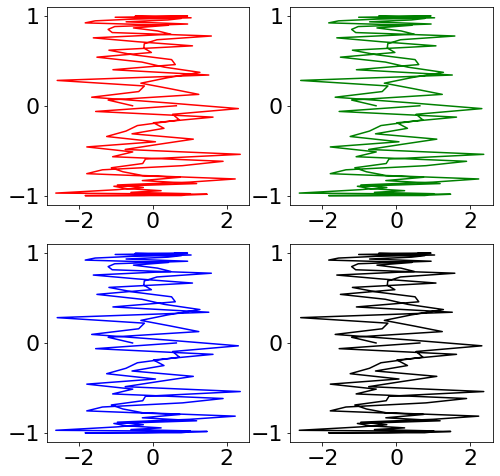
Layouts
[38]:
fig, axes = plt.subplots(2,2,figsize=(8,8))
axes[0,0].plot(x,y, 'r')
axes[0,1].plot(x,y, 'g')
axes[1,0].plot(x,y, 'b')
axes[1,1].plot(x,y, 'k')
for ax in axes.ravel():
    ax.margins(0.05)
pass
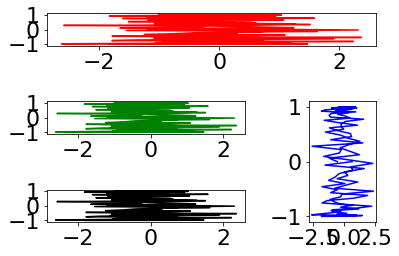
[39]:
ax1 = plt.subplot2grid((3,3), (0,0), colspan=3)
ax2 = plt.subplot2grid((3,3), (1,0), colspan=2)
ax3 = plt.subplot2grid((3,3), (1,2), rowspan=2)
ax4 = plt.subplot2grid((3,3), (2,0), colspan=2)
axes = [ax1, ax2, ax3, ax4]
colors = ['r', 'g', 'b', 'k']
for ax, c in zip(axes, colors):
    ax.plot(x, y, c)
    ax.margins(0.05)
plt.tight_layout()
Seaborn
Seaborn is a library for statistical visualizations.
[40]:
sns.set_context("notebook", font_scale=1.5, rc={"lines.linewidth": 2.5})
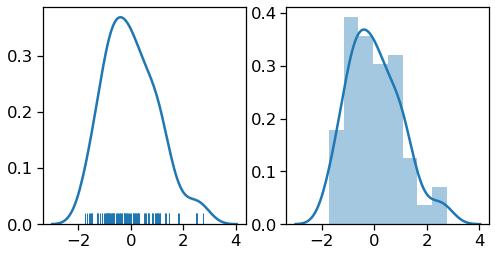
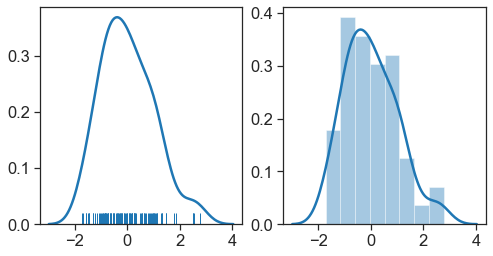
Density plots
[41]:
xs = rng.normal(0,1,100)

fig, axes = plt.subplots(1, 2, figsize=(8,4))
sns.distplot(xs, hist=False, rug=True, ax=axes[0]);
sns.distplot(xs, hist=True, ax=axes[1])
pass
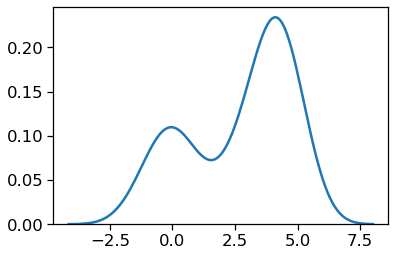
Kernel density estimate
[42]:
sns.kdeplot(np.r_[rng.normal(0,1,50), rng.normal(4,0.8,100)])
pass
[43]:
iris = sns.load_dataset('iris')
[44]:
iris.head()
[44]:
| sepal_length | sepal_width | petal_length | petal_width | species | |
|---|---|---|---|---|---|
| 0 | 5.1 | 3.5 | 1.4 | 0.2 | setosa |
| 1 | 4.9 | 3.0 | 1.4 | 0.2 | setosa |
| 2 | 4.7 | 3.2 | 1.3 | 0.2 | setosa |
| 3 | 4.6 | 3.1 | 1.5 | 0.2 | setosa |
| 4 | 5.0 | 3.6 | 1.4 | 0.2 | setosa |
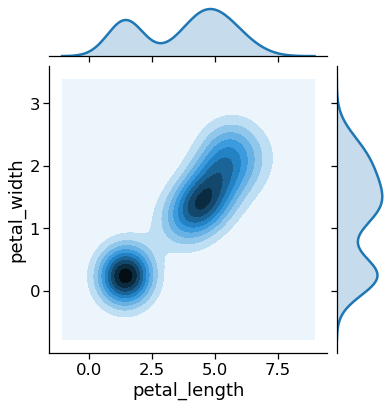
Joint distribution plot
[45]:
sns.jointplot(x='petal_length', y='petal_width', data=iris, kind='kdeplot')
pass
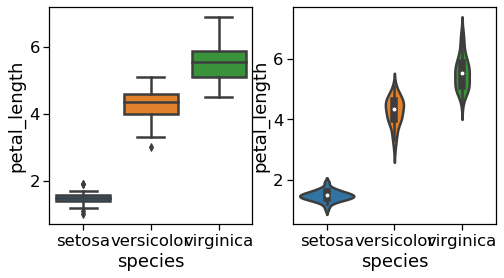
Box and violin plots
[46]:
fig, axes = plt.subplots(1, 2, figsize=(8,4))

sns.boxplot(x='species', y='petal_length', data=iris, ax=axes[0])
sns.violinplot(x='species', y='petal_length', data=iris, ax=axes[1])
pass
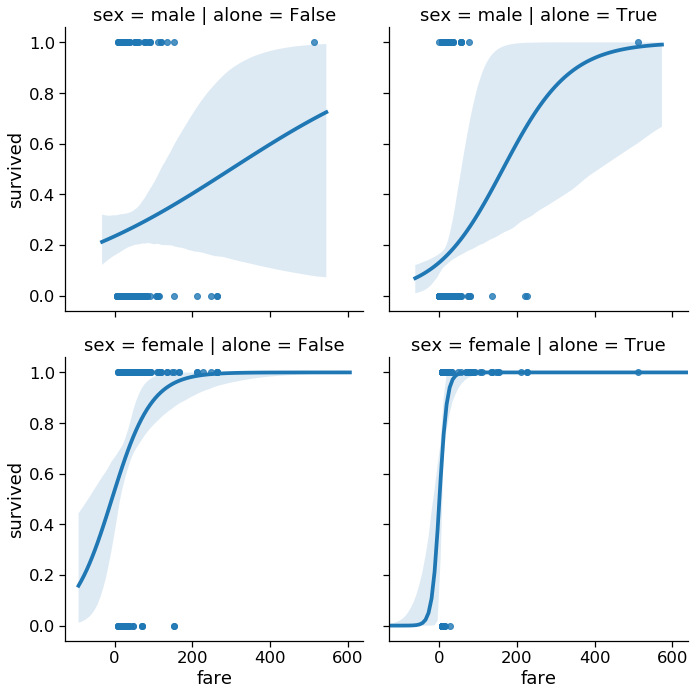
Composite plots
[47]:
url = 'https://raw.githubusercontent.com/mwaskom/seaborn-data/master/titanic.csv'
titanic = pd.read_csv(url)
[48]:
titanic.head()
[48]:
| survived | pclass | sex | age | sibsp | parch | fare | embarked | class | who | adult_male | deck | embark_town | alive | alone | |
|---|---|---|---|---|---|---|---|---|---|---|---|---|---|---|---|
| 0 | 0 | 3 | male | 22.0 | 1 | 0 | 7.2500 | S | Third | man | True | NaN | Southampton | no | False |
| 1 | 1 | 1 | female | 38.0 | 1 | 0 | 71.2833 | C | First | woman | False | C | Cherbourg | yes | False |
| 2 | 1 | 3 | female | 26.0 | 0 | 0 | 7.9250 | S | Third | woman | False | NaN | Southampton | yes | True |
| 3 | 1 | 1 | female | 35.0 | 1 | 0 | 53.1000 | S | First | woman | False | C | Southampton | yes | False |
| 4 | 0 | 3 | male | 35.0 | 0 | 0 | 8.0500 | S | Third | man | True | NaN | Southampton | no | True |
[49]:
sns.lmplot(x='fare', y='survived', col='alone', row='sex', data=titanic, logistic=True)
pass
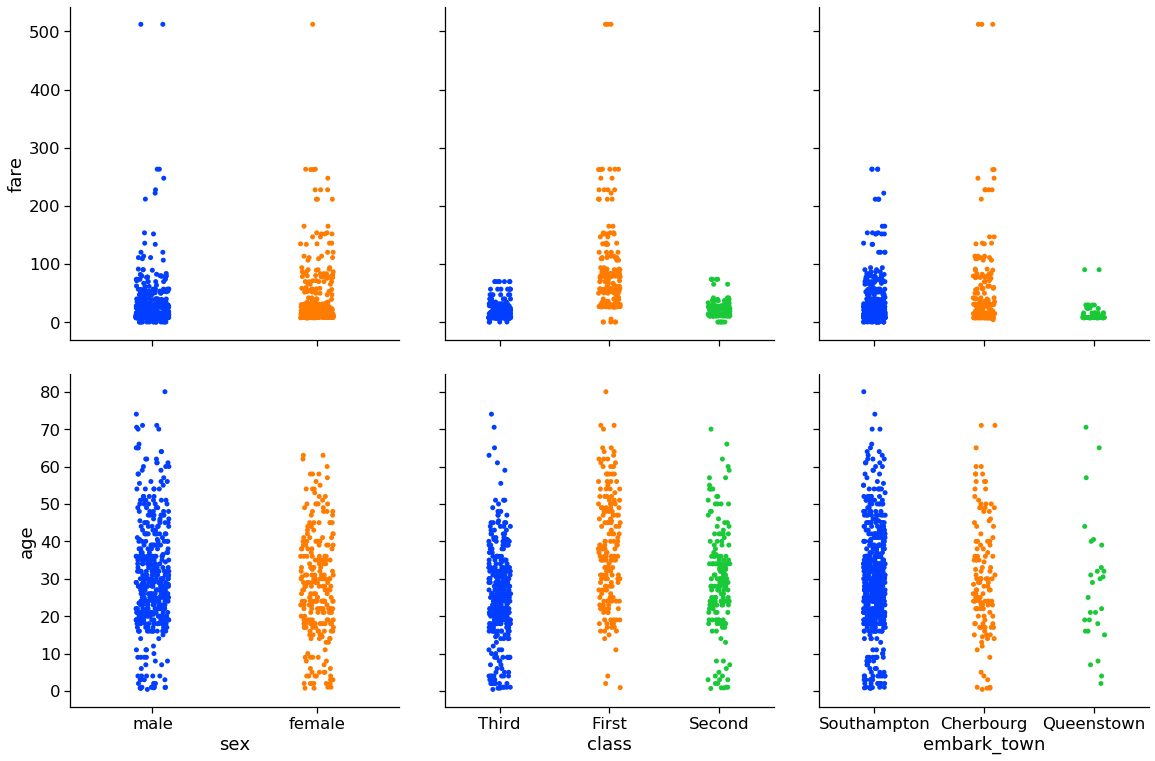
[50]:
g = sns.PairGrid(titanic,
                 y_vars=['fare', 'age'],
                 x_vars=['sex', 'class', 'embark_town' ],
                 aspect=1, size=5.5)
g.map(sns.stripplot, jitter=True, palette="bright")
pass
Seaborn styles (themes)
[51]:
sns.set_style('ticks')
[52]:
fig, axes = plt.subplots(1, 2, figsize=(8,4))
sns.distplot(xs, hist=False, rug=True, ax=axes[0]);
sns.distplot(xs, hist=True, ax=axes[1])
pass
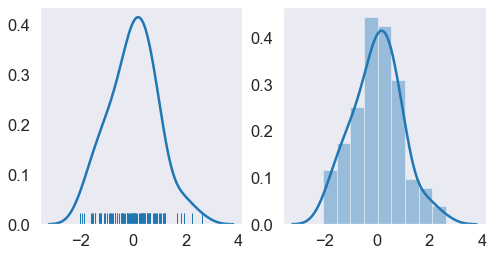
[53]:
sns.set_style('dark')
[54]:
xs = rng.normal(0,1,100)

fig, axes = plt.subplots(1, 2, figsize=(8,4))
sns.distplot(xs, hist=False, rug=True, ax=axes[0]);
sns.distplot(xs, hist=True, ax=axes[1])
pass
[55]:
sns.set_style('darkgrid')
[56]:
fig, axes = plt.subplots(1, 2, figsize=(8,4))
sns.distplot(xs, hist=False, rug=True, ax=axes[0]);
sns.distplot(xs, hist=True, ax=axes[1])
pass

plotnine
If you just want a clone of ggplot2 in Python, check out plotnine
Grammar of Graphics
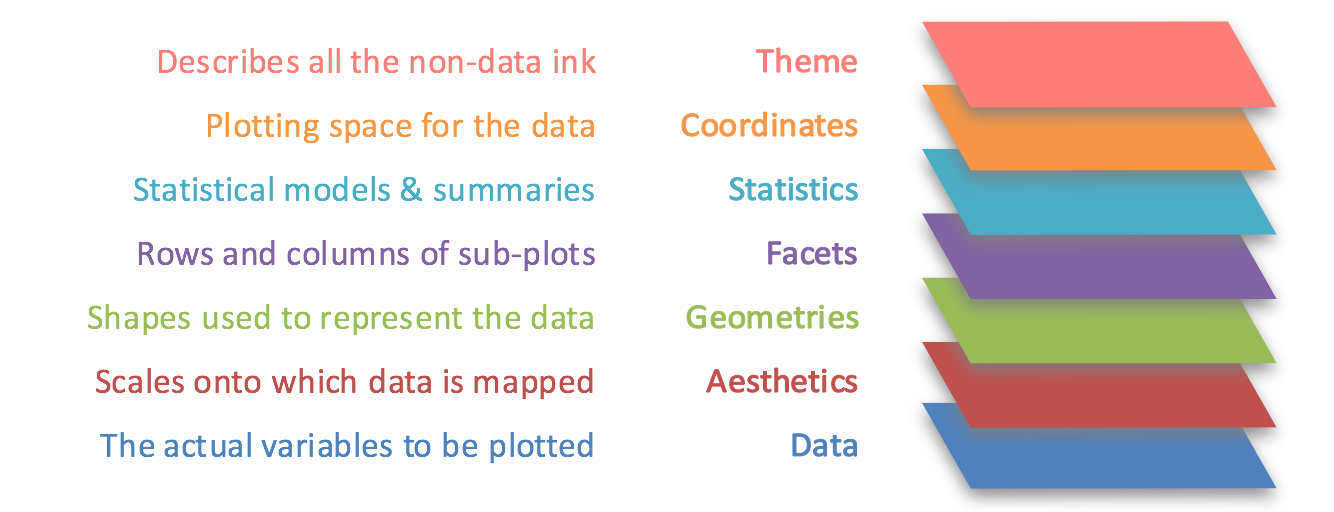
Source: http://blog.gramener.com/grammar-of-graphics-data-stories/
[57]:
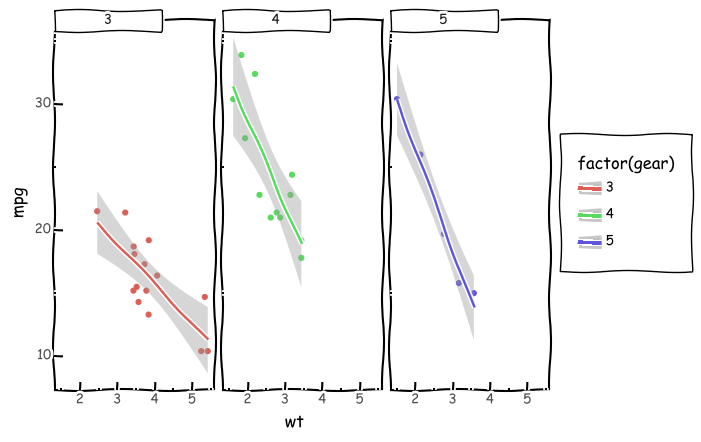
from plotnine import ggplot, geom_point, aes, stat_smooth, facet_wrap, theme_xkcd
from plotnine.data import mtcars

(
    ggplot(mtcars, aes('wt', 'mpg', color='factor(gear)'))
    + geom_point()
    + stat_smooth(method='lm')
    + facet_wrap('~gear')
    + theme_xkcd()
)
[57]:
<ggplot: (7551959525)>
[ ]: